How to monitor workflows
There are different views provided by PanDA monitor to navigate over the workflow computation progress. The PanDA monitor can show the details in different levels:
Workflow. The workflow progress shows the processing state for the entire execution graph. One workflow is one user request, which can includes multiple tasks.
Task. One task perform the unique kind of data processing against a range of data. This is the example of some tasks in the Rubin workflow: measure, forcedPhotCcd,mergeMeasurements, writeObjectTable, consolidateObjectTable, visit_detector, coadd, diffim, forced_phot, etc.
Job. One task can includes multiple jobs. One job is an execution payload, which normally is an execution unit in a batch system. Jobs in one task normally has the same execution instrutions but with different input data. In Rubin, the input data is marked as pseudo input files, which encode the quantum graph file and the data node id to be processed.
The primary monitoring tool used with the test PanDA setup is available on this address:
https://usdf-panda-bigmon.slac.stanford.edu:8443 (USDF PanDA)
First-time access may require adding this site to the secure exception list, this happens because the site SSL certificate has been signed by the CERN Certification Authority. The inner views of this website require authentication, then Google or GitHub authentication is the easiest way to do this.
Workflow progress
The workflow summary is available on this address:
https://usdf-panda-bigmon.slac.stanford.edu:8443/idds/wfprogress (USDF PANDA)
(Follow instructions on https://cafiles.cern.ch/cafiles/certificates/list.aspx?ca=grid and install CERN Grid certification Authority in the browser)
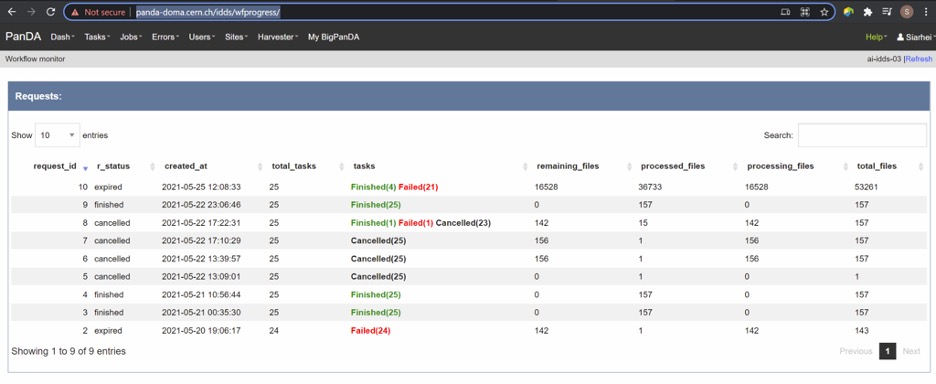
Fig 3. Screenshot of the Workflow progress view
This page provides an overview of the workflow progress:
-  requst_id is the number of the workflow in the iDDS server

-  created_at is the time when the workflow was submitted in the iDDS
   server. Time provided in the UTC time zone.

-  total_tasks is the number of tasks used for grouping jobs of the same
   functional role

-  tasks column provides link to tasks in different status

-  all rest columns provides count of input files in different statuses
Once a new workflow has submitted it can take about 20 minutes to appear in the workflow monitoring
Tasks progress
Tasks view provides more detailed information about statuses of tasks in the workflow. There are different ways how such a list of tasks could be retrieved. One of the ways is to drill down using the link provided in the WorkFlow progress view described earlier. Another way is to use the workflow name, e.g.:
https://usdf-panda-bigmon.slac.stanford.edu:8443/tasks/?name=shared_pipecheck_20210525T115157Z*
This view displays a short summary of tasks, its statuses and progress. For example, a line of the summary table shown in the fig 4.

Fig 4. Example of the task summary on the tasks view
In this line the first column is the task id in the PanDA system linked to a task detailed view. The second column provides the task name. There is a message displayed here: “insufficient inputs are ready. 0 files available, 1*1 files required” this means that not all pseudo inputs (data ids) for this task are released because the previous steps are not yet finished and currently this task has no unprocessed inputs. The third column shows the task status and number of pseudo inputs (data ids) registered for this task. Each data input corresponds to a unique job to be submitted in the computation cluster. In this case the task unites 1180 jobs. The third column shows the overall completion progress (84% or 1001 jobs) and the failure rate (9% or 64 jobs).
Following columns used for the system debug.
Jobs progress
Clicking on the task id or its name on the tasks view the detailed information is loaded, as shown on the fig. 5:
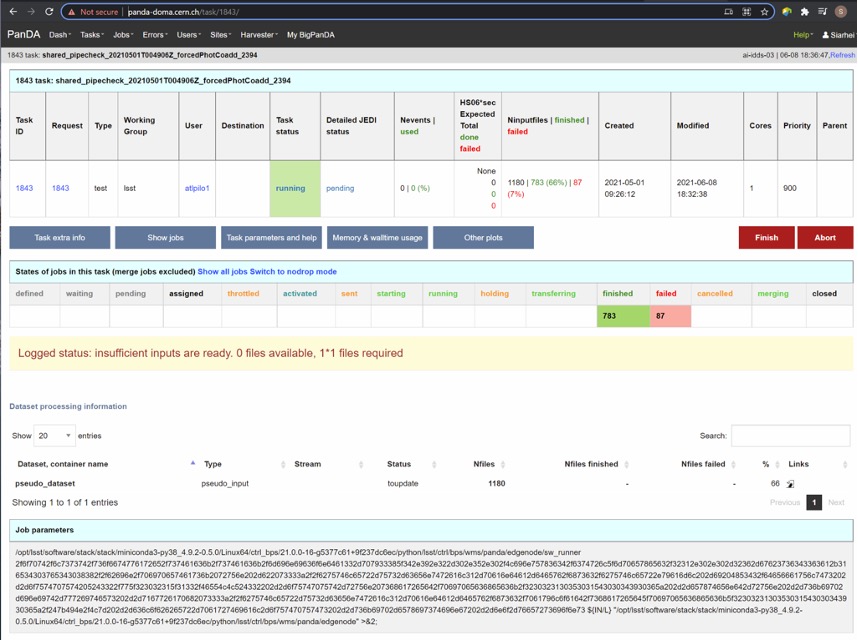
Fig 5. Task details
Here one can see several tables, one of the most important is the jobs summary. In this table all jobs of the task are counted and grouped by their statuses. Since PanDA uses late jobs generation, a job is generated only when the next available input is released.
There are two retry filtration modes supported: drop and non drop. They could be switched by clicking the correspondent link in the table head. The drop mode hides all failed jobs which were successfully retried and shows only failures which are hopeless or not yet addressed by the retry module. The drop mode is the default one. The non drop mode shows every failure regardless if they were retried. It could be directly specified in the query URL as follows:
https://usdf-panda-bigmon.slac.stanford.edu:8443/task/<taskid>/?mode=nodrop
Logs access
PanDA monitor provides central access to logs generated by running jobs(providing links to the log system). A log becomes accessible when a job is in the final state - e.g. finished or failed. For Rubin, logs are transferred to the object store and then available for download from there. There are 2 kinds of job logs available: the Rubin software output and the Pilot log which arrange the job run on the computation node. (The pilot log is mainly for system administrators to understand system issues when something doesn’t work. Normally users don’t need to dig it. Users normally only need to check the payload stdout and stderr.)
To access the job log one should load the job details page first. It is accessible as:
https://usdf-panda-bigmon.slac.stanford.edu:8443/job/<jobid>/
The job page could be also navigated starting from the task page:
task - > list of jobs in particular state -> job
Once a job page has landed a user should click: Logs -> Pilot job stderr. This will download the Rubin SW output.
Real-time logs access
This part requires users having lsst.cloud accounts.
The Rubin jobs on the PanDA queues are also provided with (near)real-time logging on Google Cloud Logging. Once the jobs have been running on the PandDA queues, users can check the json format job logs on the Google Logs Explorer. To access it, you need to login with your Google account of lsst.cloud, and select the project of “panda-dev” (the full name is panda-dev-1a74).
On the Google Logs Explorer, you make the query. Please include the logName Panda-RubinLog in the query:
For specific PanDA task jobs, you can add one field condition on jsonPayload.TaskID in the query, such as:
For a specific individual panda job, you can include the field jsonPayload.PandaJobID. Or search for a substring “Importing” in the log message:
Or ask for logs containing the field “MDC.RUN”:
You will get something like:
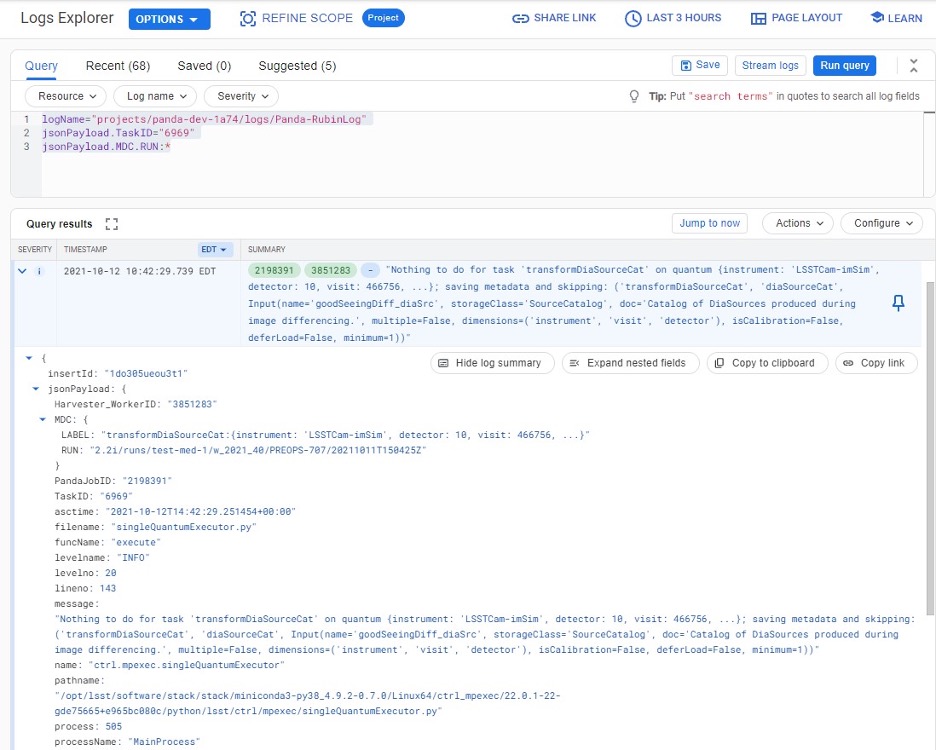
You can change the time period from the top panel. The default is the last hour. And you can also pull down the Configure menu (on the middle right) to change what to be displayed on the Summary column of the query result.
There are more fields available in the query. As you are typing in the query window, it will show up autocomplete field options for you.
You can visit the page of Advanced logs queries for more details on the query syntax.
Monitor of job resource utilization
For finished and some failed jobs PanDA monitor offers a set of plots with various job metrics collected by the prmon tool embedded to the user payload. To open that plots user should click on the “Memory and IO plots” button placed on a job view like shown on the fig.7 and open the popup link.
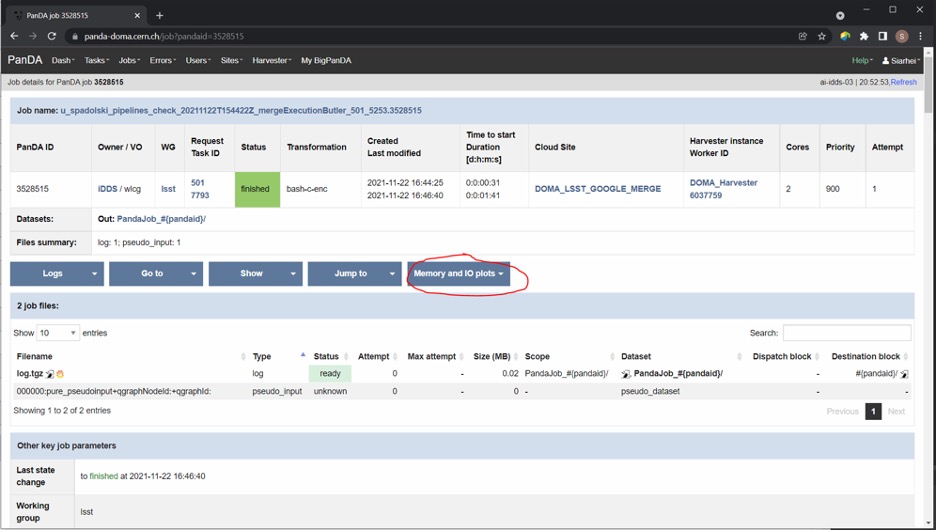
Fig 7. “Memory and IO plots” button
Prmon logs are also available in the textual form. Correspondent links are available in the “Logs” block of the menu.
How to debug a workflow
Workflow points of inspection
Different metrics could be inspected to check workflow progress and identify possible issues. There are few of them:
-  Is the workflow properly submitted? This could be checked looking
    into the https://usdf-panda-bigmon.slac.stanford.edu:8443/idds/wfprogress/ table. If the
    workflow with id provided during submission is in the table, then
    it went into the iDDS/PanDA systems.

-  Are there any failures not related to node preemption? To check this
    user should list failed jobs and check type of occurred errors:

..

https://usdf-panda-bigmon.slac.stanford.edu:8443/jobs/?jeditaskid=\ <task>&jobstatus=failed
Workflow cancel/retry
If the BPS_WMS_SERVICE_CLASS is not set, set it through:
$> export BPS_WMS_SERVICE_CLASS=lsst.ctrl.bps.panda.PanDAService
To abort the entire workflow the following command could be used:
$> bps cancel --id <workflowid>
If there are many failed jobs or tasks in a workflow, the restart command could be applied to the whole workflow to reactivate the failed jobs and tasks:
$> bps restart --id <workflowid>
(When `bps restart` is called to PanDA service, the activities that PanDA does is to retry the workflow. When retrying a workflow, all finished tasks and jobs will not be touched. If the workflow is still running, retrying will re-activate the failed tasks and jobs to rerun them (The queuing or running jobs will not be affected). If the workflow is terminated, retrying will re-activate all unfinished tasks and jobs. From the monitoring view, all monitor pages will be the same. The only difference should be that the number of retries is increased.)